魔方扫描仪
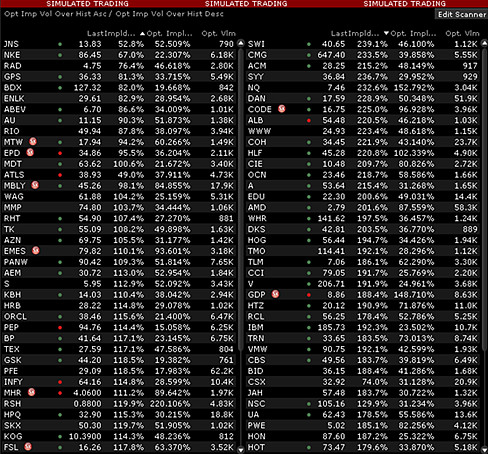
下方魔方图表显示的是期权成交量均超过750张合约的纽交所股票。图表分双序排列,左侧显示的股票按照隐含波动率与历史波动率比值的大小排序,且由小到大排列。相反,右侧显示的股票则采用期权定价的形式显示股票的不确定性与股价随着时间推移的实际变动比值的大小排序,且由大到小排列(译者注:这里的不确定性即指隐含波动率,股价的实际变动指历史波动率)。例如,扫描仪左侧的首支股票-骏利资产管理集团有限公司(代码:JNS)其期权的隐含波动率数值为52.55,属于52周最高值,但是该数值远远低于历史波动率数值(即99.1%)。这一转变发生在被誉为债券大王的传奇人物比尔·格罗斯宣布辞去在太平洋投资管理公司(Pimco)的职务,转投骏利成立基金期间。此消息对股价的推动作用改变了历史波动率数值,但这一作用随后快速消失。与此同时,债券市场的波动性以及资产管理公司股价的回调使得市场前景看似越发的不确定,诱使投资者提高期权隐含波动率数值。右侧图表显示的首支股票为太阳风公司(代码:SWI),随着股价触及两个月的最低值,该公司的隐含波动率达到6个月最高值。
英文原文:
Mosaic Market Scanner
The Mosaic table below details NYSE-listed stocks with options volume inexcess of 750 contracts. The screen is dual-sorted, with stocks on the leftdisplaying the lowest ratio of implied volatility in comparison to historicvolatility. Conversely, stocks displayed on the right use option pricing toshow the greatest reading of uncertainty for the underlying stock compared tothe actual behavior of the share price over time. For example, leading thetable on the left of the scanner is Janus Capital Group Inc. (Ticker: JNS),whose option implied volatility reading of 52.55 is at a 52-week high, butstands well below the historical reading for volatility on the stock at 99.1%.In this case the shift occurred when legendary bond king Bill Gross announcedhe was quitting Pimco to launch his own fund for Janus. The resultant boost tothe share price that shifted the reading for historical volatility isfast-fading. Meanwhile broad market volatility and the pullback for shares inthe asset manager are tempting investors to raise the option implied reading asthe outlook looks increasingly uncertain. Leading the other side of the tableis Solarwinds Inc. (Ticker: SWI) where implied volatility is at a six-monthhigh as its share price tests a two-month low.

如有任何疑问请发邮件至help@ibkr.com或致电(852)2156 7921转接
这篇文章已被翻译成中文。 如英文版本和中文版本之间有任何不一致,以英文版本为准。
期货投资涉及风险,并不适合所有投资者。要获取更多的相关信息,请阅读“标准期权的特征和风险”。要获取副本,请访问interactivebrokers.com/disclosures 或致电203-618-5800寻求帮助。
文中显示的任何交易代码仅作为演示计,并不代表推荐意图。
盈透交易员睿智中提供的内容(包括文章和评论)仅作为资讯用途。发布的内容并不代表盈透证券建议您或您的客户联系独立顾问或对冲基金以期获取其服务或投资其产品,也不代表建议您联系在盈透交易员睿智发布文章或向顾问、对冲基金投资的相关人士。在盈透交易员睿智中发布文章的顾问、对冲基金或其他分析师均独立于盈透证券,盈透证券不会对这些顾问、对冲基金或其他人士的过往或将来表现,或其提供的信息之准确性做出任何声明或担保。盈透证券不会进行“适宜性评估”来确保顾问、对冲基金或其他参与方的交易适合于您。
发布内容中提及的证券或其他金融产品并非适合所有投资者。发布的内容并未从您的投资目标、财务状况或需求出发,并不旨在向您推荐任何证券、金融产品或策略。进行投资或交易前,您应考虑该产品是否适合您的特定情况,如有需要,请咨询相关人士获取专业的建议。过往业绩并不代表将来表现。
盈透或其分支机构的雇员所发布的任何信息均基于公认的真实可信的信息。然而,盈透或其分支机构无法保证信息的完整性、准确性和适当性。盈透不对任何金融产品其过去或将来的表现作出任何声明或担保。交易员睿智中发布的文章并不代表盈透认为任何特定金融产品或交易策略适合您。