Steep year-on-year declines driven by comparisons to 2022’s all-time highs 与2022年的历史高点相比,同比大幅下降
Greg Miller 格雷格•米勒 ·Monday, May 15, 2023 2023年5月15日星期一
The double-digit declines keep piling up for container shipping. 集装箱航运业两位数的降幅不断增加。
The Port of Long Beach said Friday that April imports fell 22% from the year before. Taiwanese ocean carriers Evergreen and Yang Ming reported that first-quarter profits plunged 95% and 94% year-on-year (y/y), respectively. South Korean carrier HMM said Monday that its first-quarter net income sank 91% y/y. 长滩港(Port of Long Beach)上周五说,4月份进口量较上年同期下降22%。台湾远洋运输公司长荣(Evergreen)和阳明(Yang Ming)报告称,第一季度利润同比分别下降95%和94%。韩国航运公司HMM周一说,该公司第一季度净利润同比下降91%。
The prior week, Maersk reported a 66% y/y fall in Q1 net income on a 37% decline in freight rates. Hapag-Lloyd reported a 57% y/y drop in net income as its rates fell 28%. 上周,马士基报告第一季度净利润同比下降66%,运费下降37%。赫伯罗特公布净利润同比下降57%,运费下降28%。
The container shipping industry is awash in double-digit declines because the numbers a year ago were historically high. 集装箱航运业正以两位数的速度下滑,因为一年前的数据处于历史高位。
Big numbers make for eyeball-grabbing headlines, both on the way up and down. Market reporters scour their thesauri for exciting new ways to say “increase” and “decrease.” But what double-digit percentages actually mean depends on the starting point. 无论是上升还是下降,大数字都会成为引人注目的头条新闻。市场记者在他们的词典中搜寻“增加”和“减少”的令人兴奋的新说法。但两位数百分比的实际含义取决于起点。
For container shipping, percentages to date show a huge drop from best-in-history profits to more modest profits and from unprecedented, off-the-charts volumes to normal volumes. 就集装箱航运而言,迄今为止的百分比显示,从历史上最好的利润大幅下降到较为温和的利润,从前所未有的、超出图表的货运量大幅下降到正常的货运量。
Industry yet to ‘lap’ records 工业还没有“超越”记录
The drumbeat of attention-getting y/y declines is far from over. 引人注目的年率降幅的鼓声远未结束。
Earnings and average rates (including both contract and spot) of most ocean carriers didn’t peak until Q3 2022. Import volumes to the West Coast ports didn’t start falling until June 2022. Volumes to East Coast ports kept rising until August. 大多数海运公司的收益和平均费率(包括合同和现货)直到2022年第三季度才达到峰值。西海岸港口的进口量直到2022年6月才开始下降。直到8月份,美国东海岸港口的货运量一直在上升。
According to Container Trades Statistics, global volumes peaked last May but didn’t fall sharply until September. The Harpex Index, which measures container-ship charter rates, remained near its highs until August. 据集装箱贸易统计(Container Trades Statistics),全球货运量在去年5月达到峰值,但直到9月才大幅下降。衡量集装箱船租船费率的Harpex指数在8月份之前一直接近高位。
The double-digit drops will vanish when the container shipping industry “laps” these dates later in 2023. In some cases, percentages may turn positive. 当集装箱航运业在2023年晚些时候“赶上”这些日期时,两位数的降幅将消失。在某些情况下,百分比可能转为正值。
Comparisons to pre-COVID numbers 与covid前的数字比较
There is no historical precedent for the 2021-2022 container shipping boom — an anomaly caused by the pandemic. However, there is precedent in commodity shipping: the 2003-2008 boom in dry bulk and tanker shipping caused by another one-off event — China’s rapid ascent in world trade. 2021-2022年的集装箱航运繁荣是历史上没有先例的,这是由疫情引起的异常现象。然而,大宗商品航运也有先例:2003年至2008年干散货和油轮航运的繁荣,是由另一个一次性事件——中国在世界贸易中的迅速崛起——引起的。
Hedge funds and private-equity funds made disastrous market bets in the years following that earlier supercycle by including the inflated returns of 2003-2008 in their forward expectations for “normal” market conditions. The lesson learned after massive losses on commodity shipping investments in the early teens: Focus less on the outlier period and more on what happened before and after. 对冲基金和私募股权基金在早期超级周期之后的几年里对市场进行了灾难性的押注,他们将2003-2008年的膨胀回报纳入了对“正常”市场状况的预期。十几岁的时候,大宗商品运输投资遭受了巨大损失,从中得到的教训是:少关注异常期,多关注之前和之后发生的事情。
Doing so in container shipping tells a different story. Long Beach’s April’s import volumes — 313,444 twenty-foot equivalent units — were up 58,474 TEUs, or 23%, from the recent low in February. This April’s imports were flat versus imports in April 2019 and 2018 (minus 1.4% and plus 0.3%, respectively). 而在集装箱运输领域,情况则截然不同。长滩4月份的进口量为313,444个20英尺标准箱,较2月份的近期低点增加了58,474个标准箱,增幅为23%。今年4月的进口与2019年和2018年4月的进口持平(分别为- 1.4%和+ 0.3%)。
Global Port Tracker, produced by the National Retail Federation (NRF) and Hackett Associates, shows U.S. imports this year trending closely with 2018-2019 levels. The latest Port Tracker forecast for June-September is slightly above pre-pandemic levels.由全国零售联合会(NRF)和哈克特协会(Hackett Associates)制作的《全球港口追踪》(Global Port Tracker)显示,美国今年的进口趋势与2018-2019年的水平密切相关。最新的6月至9月港口追踪预测略高于大流行前的水平。
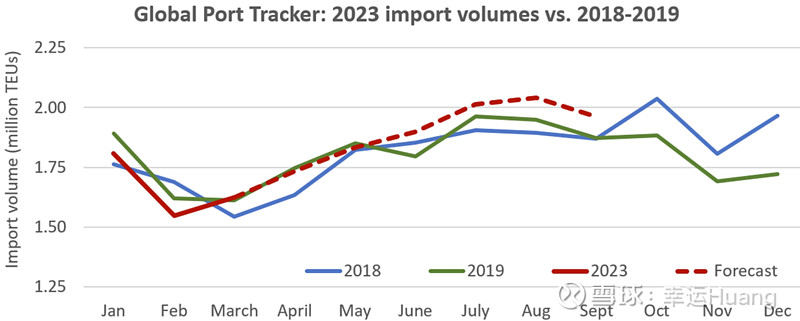
(Chart: FreightWaves based on data from NRF) (图表:基于NRF数据的FreightWaves)
HMM posted net income of $213 million for Q1 2023. In Q1 2019, pre-COVID, it suffered a $149 million loss. Evergreen booked net income of $164 million in the first quarter of this year, nine times its net income in Q1 2019. Maersk’s average freight rate, including the positive effect of legacy contracts was 51% higher in Q1 2023 than Q1 2019. Hapag-Lloyd’s was 85% higher.HMM公布2023年第一季度净收入为2.13亿美元。2019年第一季度,在covid之前,它遭受了1.49亿美元的损失。长荣今年第一季度的净收入为1.64亿美元,是2019年第一季度净收入的9倍。包括遗留合同的积极影响在内,马士基2023年第一季度的平均运费比2019年第一季度高出51%。赫伯罗特则高出85%。
The Harpex charter-rate index is up 17% from the low hit in March. It’s now just over double its level in mid-May 2019. Harpex租船费率指数较3月份的低点上涨了17%。现在是2019年5月中旬的两倍多一点。
Even spot rates — which have fallen much faster than charter rates, liner earnings and port volumes — are still up on a global basis versus pre-COVID. The Drewry World Container Index global composite is down 77% y/y but 23% higher than the 2019 average. 即使是现货运价——其下降速度远快于租船运价、班轮收益和港口吞吐量——在全球范围内也比新冠疫情前有所上升。德鲁里世界集装箱指数全球综合指数同比下降77%,但比2019年的平均水平高出23%。
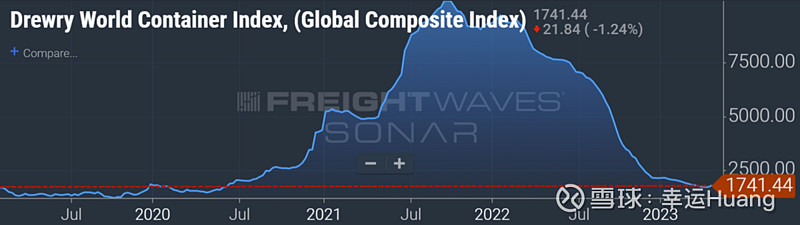
Average spot rate in USD/FEU. (Chart: FreightWaves SONAR) 美元/FEU的平均即期运费。(图表:FreightWaves声纳)
What happened after 2003-2008 boom? 2003-2008年的繁荣之后发生了什么?
Container lines and cargo shippers had never seen anything like the 2021-2022 rate spike. But the violent market swing was very familiar to commodity shipping veterans who amassed fortunes from 2003 to 2008. 集装箱航运公司和货运公司从未见过2021-2022年费率如此飙升的情况。但对于2003年至2008年积累了大量财富的大宗商品航运资深人士来说,剧烈的市场波动是非常熟悉的。
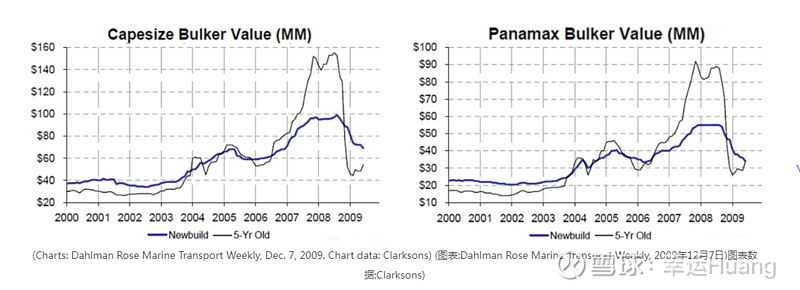
Values for 5-year old Capesize (dry bulk vessels with capacity of around 180,000 deadweight tons or DWT) quintupled, from $30 million in 2003 to over $150 million in 2008. Then they went off a cliff and sank back to $40 million by 2009. Values for 5-year-old Panamaxes (65,000-90,000 DWT) rose six-fold from $15 million to $90 million, then suddenly crashed to $30 million. 5年船龄好望角型(容量约为180,000载重吨的干散货船)的价值翻了五倍,从2003年的3,000万美元增至2008年的1.5亿美元以上。然后,他们跌入了悬崖,到2009年又跌回了4000万美元。5年船龄的巴拿马型船(65000 - 90000载重吨)的价值从1500万美元涨到9000万美元,涨了6倍,然后突然暴跌至3000万美元。
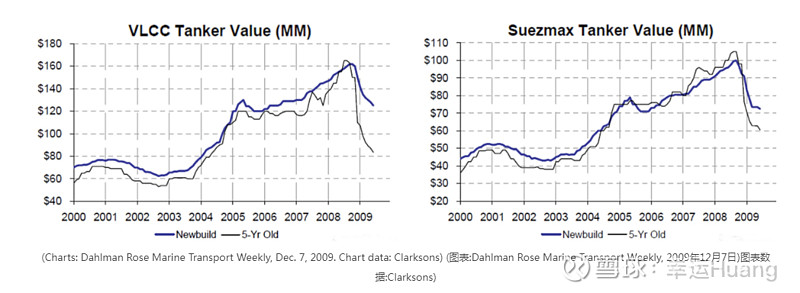
Values of 5-year-old very large crude carriers (tankers that carry 2 million barrels) jumped from $60 million to $165 million. Then they sank back to $80 million. Values of 5-year-old Suezmaxes (tankers that carry 1 million barrels) soared from $40 million to $105 million, then fell to $60 million. 拥有5年历史的超大型油轮(装载200万桶原油的油轮)的价值从6000万美元跃升至1.65亿美元。然后又跌回了8000万美元。拥有5年历史的Suezmaxes(装载100万桶的油轮)的价值从4000万美元飙升至1.05亿美元,然后又降至6000万美元。
A new wave of large investors entered shipping after the global financial crisis, betting on the “reversion to the mean” thesis. They looked at the 10-year average of rates and asset values and assumed they would revert to the mean. The fatal flaw in this thinking: The prior 10 years included a one-off boom that skewed the mean too high to revert to. 全球金融危机之后,新一波大型投资者进入航运业,押注于“回归均值”理论。他们研究了利率和资产价值的10年平均值,并假设它们会回归均值。这种思维的致命缺陷是:在此之前的10年里,出现了一次一次性的繁荣,导致均值过高,无法恢复。
“I don’t think their analysis was all that complicated,” said AMA Capital Partners CEO Paul Leand during a Marine Money conference in 2013. “我不认为他们的分析有那么复杂,”AMA Capital Partners首席执行官保罗•利德(Paul Leand)在2013年的一次海洋货币会议上表示。
“I think they looked at rates and values in 2008, they looked at where they are today and they looked at the 10-year average including 2007 and 2008 and they said: ‘It’s going up. It’s a great opportunity. We’ve got $20 billion to invest. Let’s throw $500 million into shipping.’” “我认为他们看了2008年的利率和价值,看了今天的水平,看了包括2007年和2008年在内的10年平均水平,然后说:‘它在上涨。这是一个很好的机会。我们有200亿美元可以投资。让我们在航运业投入5亿美元。’”
At the same conference, Herman Hildan, then a shipping analyst at RS Platou, advised a different approach: Use a 20-year rate average that excludes the peak earning years of 2007 and 2008 to curb the boom years’ bias. 在同一次会议上,时任RS Platou航运分析师的赫尔曼•希尔丹(Herman Hildan)提出了一种不同的方法:使用不包括2007年和2008年收入高峰年份的20年平均费率,以抑制对繁荣年份的偏见。
A decade after that debate, the same question of how to gauge the market in the aftermath of a one-off boom — and how much to focus on the outlier years — has arisen yet again, this time in container shipping. 在那场辩论过去十年后,如何在一次性繁荣过后评估市场——以及应该在多大程度上关注异常年份——同样的问题再次出现,这次是在集装箱航运领域。